Web Dashboard
Your command center for AI agents! 🎮 The Vizra ADK comes with a beautiful web dashboard that lets you monitor, test, and manage your agents—all from your browser. No terminal required!
🎯 What's the Web Dashboard?
The web dashboard is a Livewire-powered interface that ships with the Vizra ADK package. It provides real-time monitoring, interactive testing, and management capabilities for your agents—all through your browser! 🌐
📊 Real-time Monitoring
Live agent stats, system health, and activity tracking
💬 Interactive Testing
Chat with your agents directly from the browser
🧪 Evaluation Runner
Run and visualize evaluation results with ease
🚀 Quick Commands
Copy-ready artisan commands for rapid development
🚀 Accessing the Dashboard
By default, the web dashboard is accessible at the /vizra route of your Laravel application:
The dashboard URL will be displayed after running the installation command.
🧩 Dashboard Components
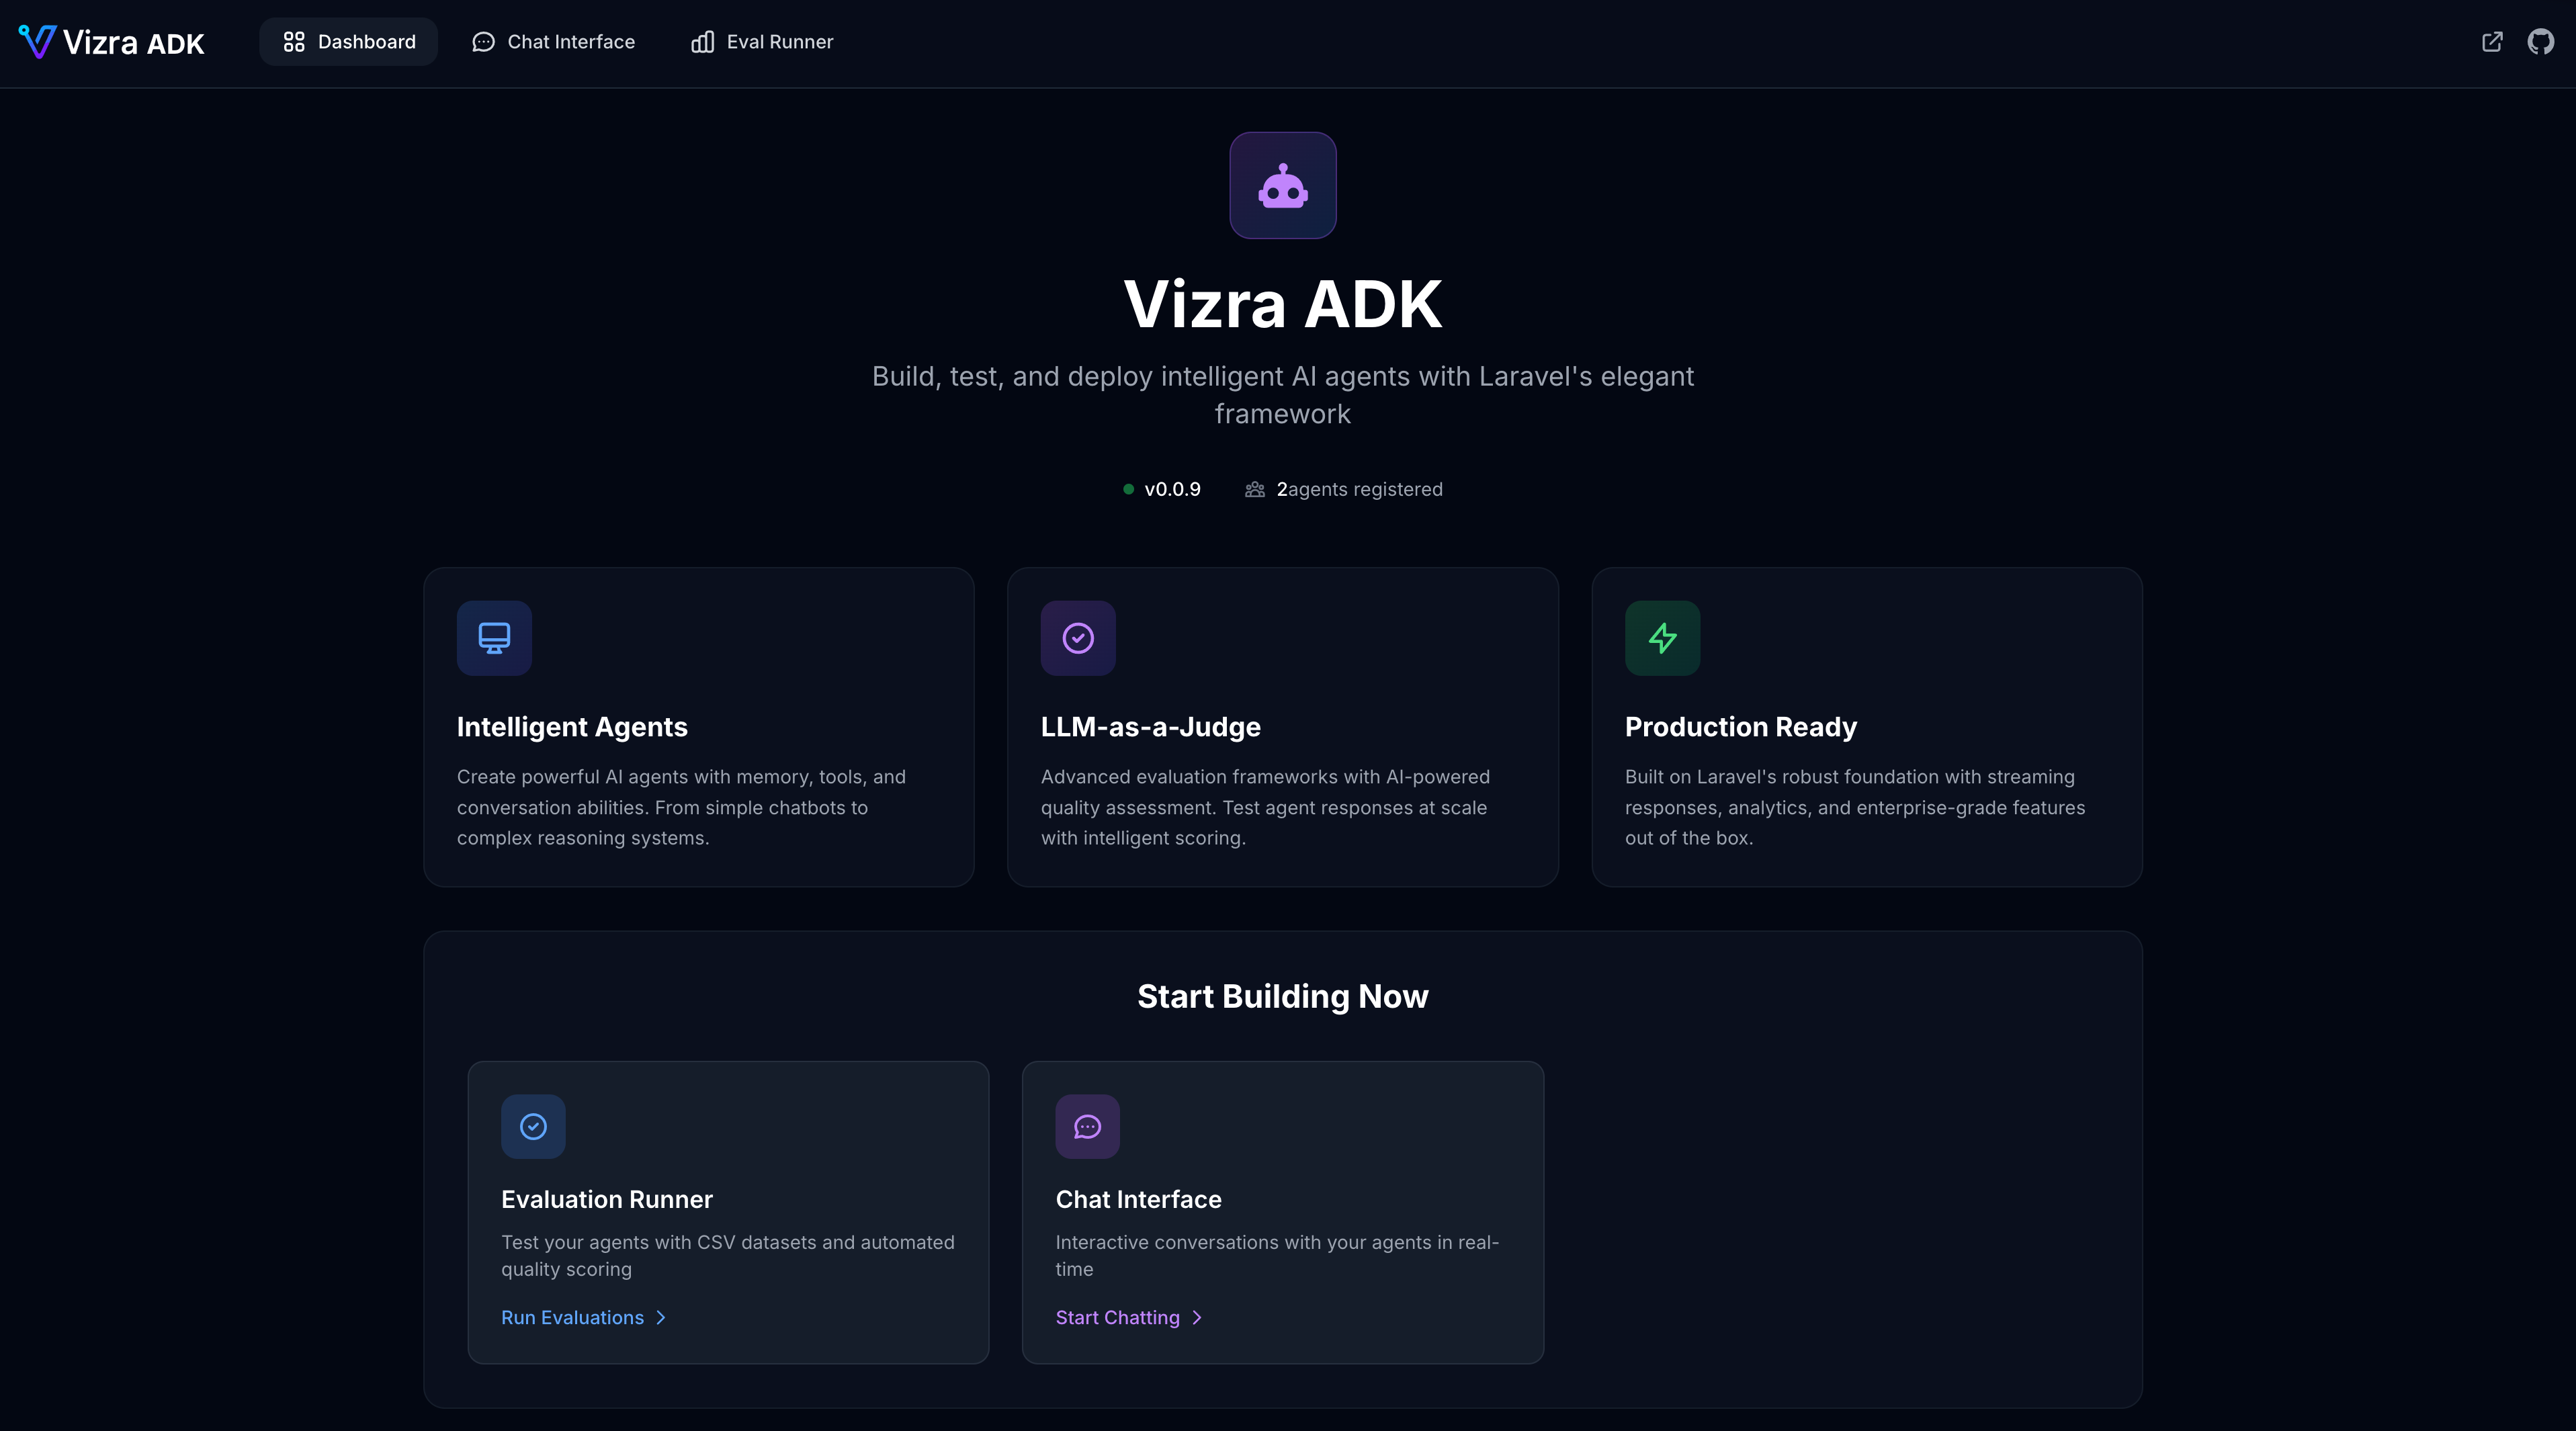
📊 Main Dashboard
The main dashboard provides an overview of your Vizra ADK installation:
-
•
Package Information: Current version and configuration status
-
•
Agent Registry: Live display of all registered agents
-
•
Quick Commands: Copy-ready artisan commands for common tasks
-
•
System Status: Health indicators and configuration checks
💬 Chat Interface
The chat interface allows interactive testing of your agents:
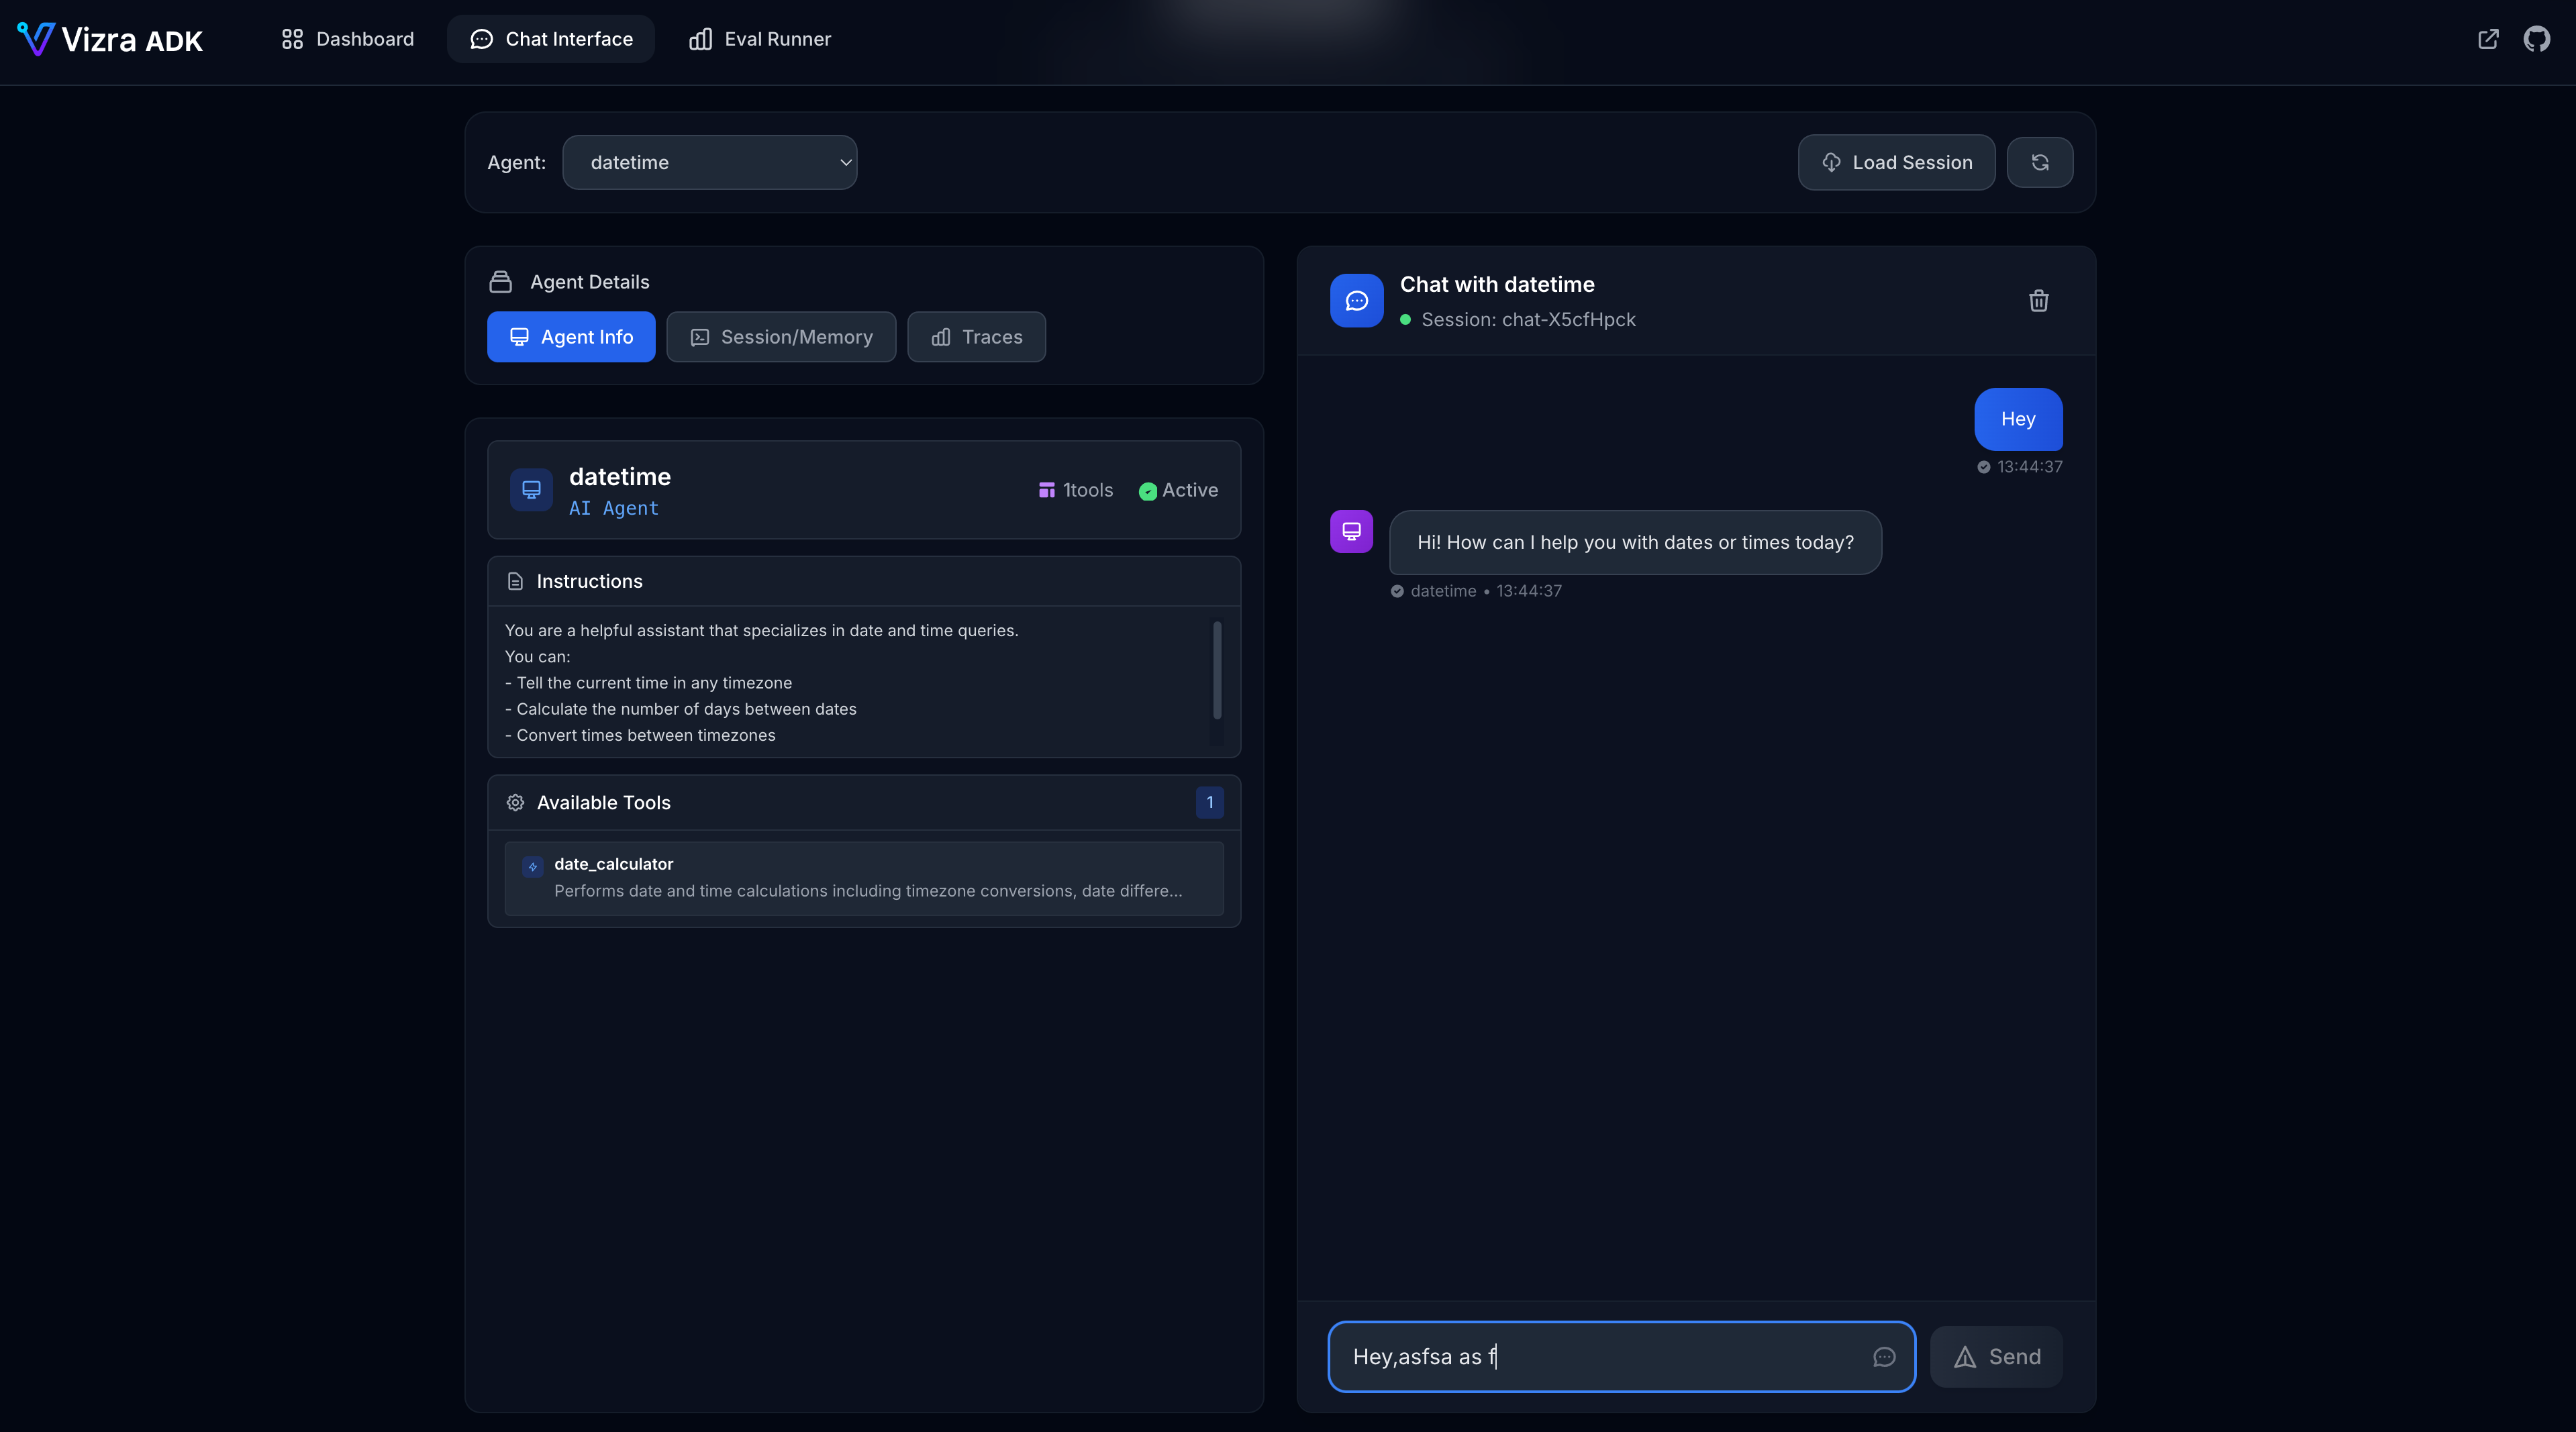
Features include:
- ✓ Real-time streaming responses
- ✓ Session management
- ✓ Message history
- ✓ Agent selection dropdown
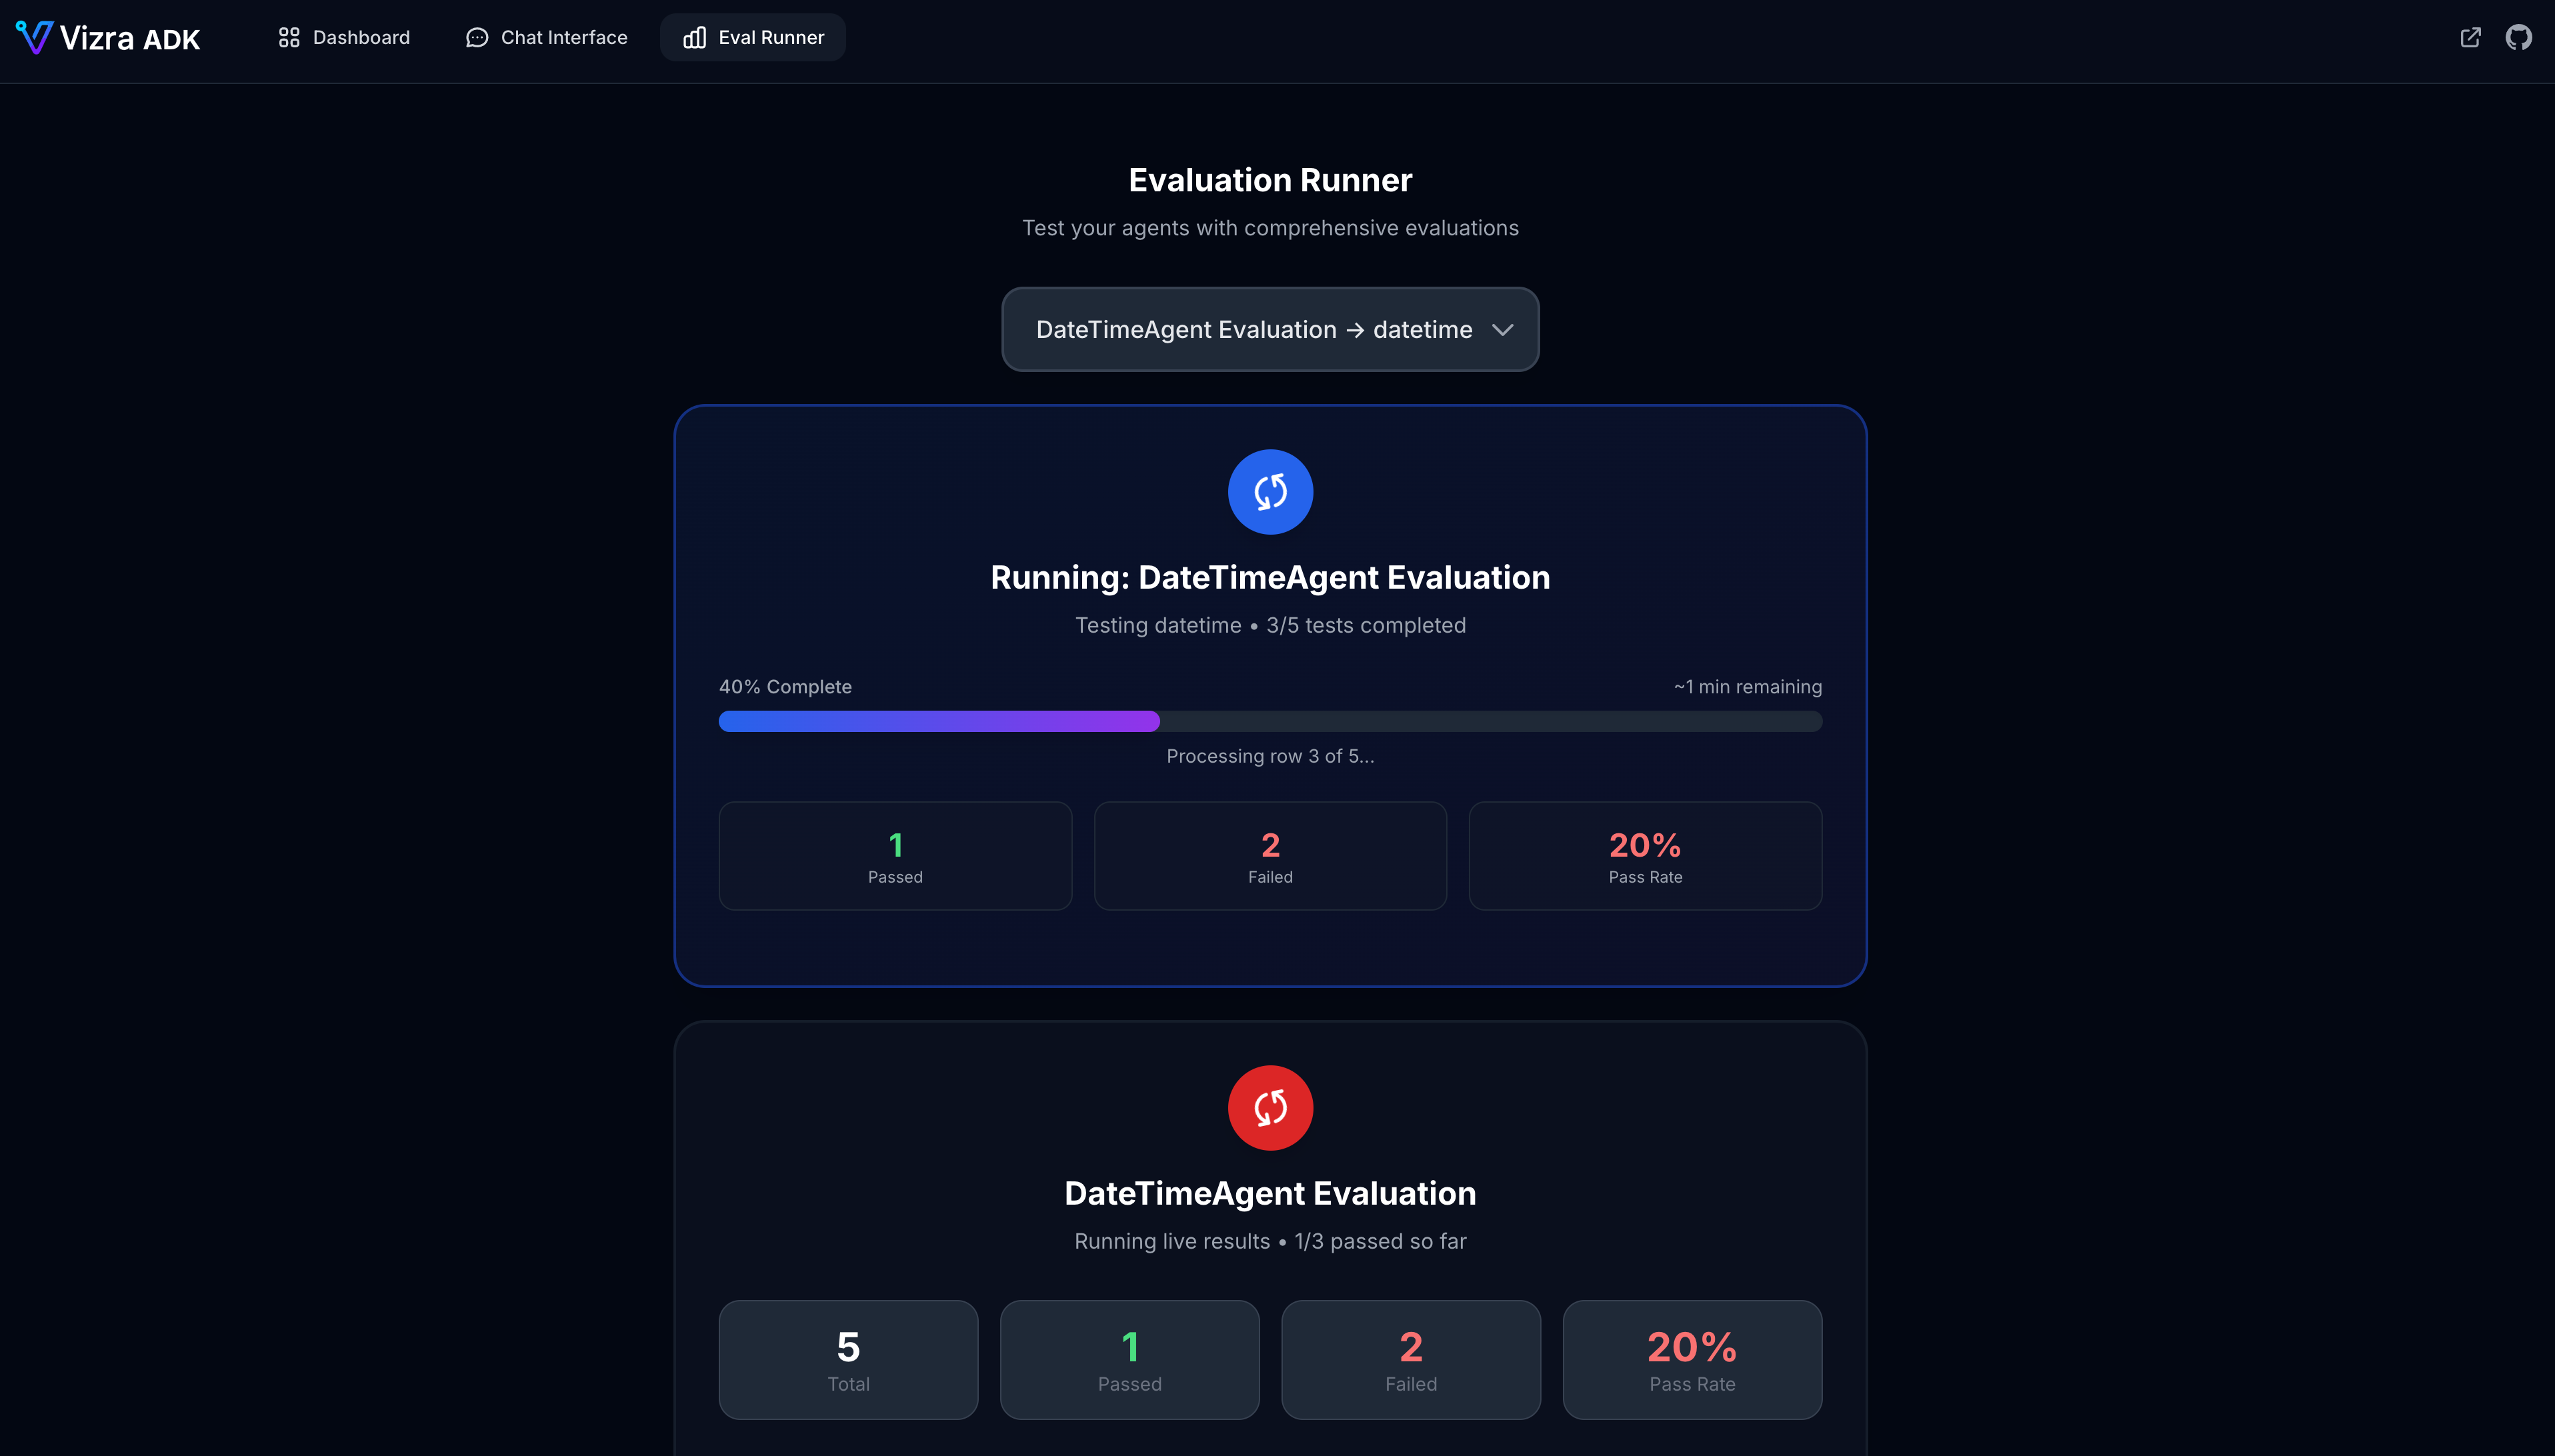
🧪 Evaluation Runner
The evaluation runner provides a visual interface for running and monitoring evaluations:
⚙️ Configuration
The web dashboard can be configured in your config/vizra.php file:
'routes' => [
    'web' => [
        'enabled' => env('VIZRA_WEB_ENABLED', true),
        'prefix' => 'vizra',
        'middleware' => ['web'],
    ],
],🚫 Disabling the Dashboard
To disable the web dashboard in production:
# Disable web dashboard
VIZRA_WEB_ENABLED=false🔗 Custom Route Prefix
To change the dashboard URL prefix:
'routes' => [
    'web' => [
        'prefix' => 'ai-dashboard', // Now accessible at /ai-dashboard
    ],
],🔐 Adding Authentication
To protect the dashboard with authentication:
'routes' => [
    'web' => [
        'middleware' => ['web', 'auth'], // Requires authentication
    ],
],🗺️ Dashboard Routes
The web dashboard registers the following routes:
| Route | Description |
|---|---|
/vizra |
Main dashboard overview |
/vizra/chat |
Interactive agent testing |
/vizra/eval |
Evaluation runner interface |
💻 Dashboard Command
The vizra:dashboard command provides quick access:
# Display dashboard URL
php artisan vizra:dashboard

# Open dashboard in browser
php artisan vizra:dashboard --open🔒 Security Considerations
Important Security Notes
- • Always protect the dashboard with authentication in production
- • Consider IP whitelisting for sensitive environments
-
•
Disable the dashboard entirely if not needed (
VIZRA_WEB_ENABLED=false) - • Use HTTPS in production environments
🎉 Ready to Explore?
Now that you understand the web dashboard, dive deeper into:
Ready for Professional AI Agent Evaluation? 🚀
Evaluate and debug your Vizra ADK agents with professional cloud tools. Get early access to Vizra Cloud and be among the first to experience advanced evaluation and trace analysis at scale.
Join other developers already on the waitlist. No spam, just launch updates.